Reviewing WAC Violations
Constraint Violations
When a constraint violation is selected from the dashboard, an analysis page is displayed with the violation criteria, filter buttons, setting parameter, and table view that the user specified in template creation. A Mho Circles graph is also displayed with the current zone reach (note that the graph is excluded if the constraint parameter is 50GP or if a setting is set as “OFF” in the relay settings).
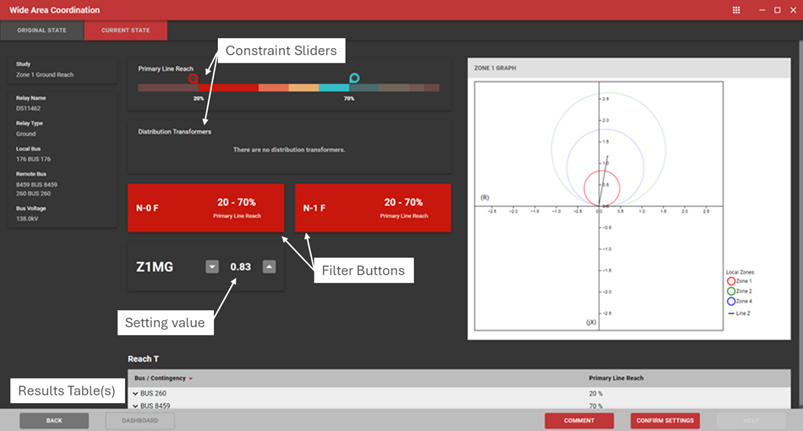
The user can interactively change the setting to achieve a more desirable result.
- If the user changes the constraint slider(s), SARA will recalculate the setting such that the reach matches the updated percentage(s). Once the calculation is complete, the updated setting and Mho circles will be displayed.
- If the user directly edits the setting value, or uses the up and down arrows in 0.01 increments, SARA will recalculate the reach percentages and show the updated Mho circle.
- If a constraint is not applicable SARA will omit the slider. For example, this can be seen in the above screenshot wherein the constraint is defined as line sweeping between high side SDT and low side SDT but no distribution transformer is present.
- The user may use the “Original State” and “Current State” tabs to toggle between the original and updated settings.
- Select “Comment” to add any comments that should be included in the final report.
- Select “Confirm Setting” to implement the updated setting. SARA displays a summary of the change, including the impact to other studies affected by the change. The user may add justification text that will be included in the report, and select “Mark as Resolved.”
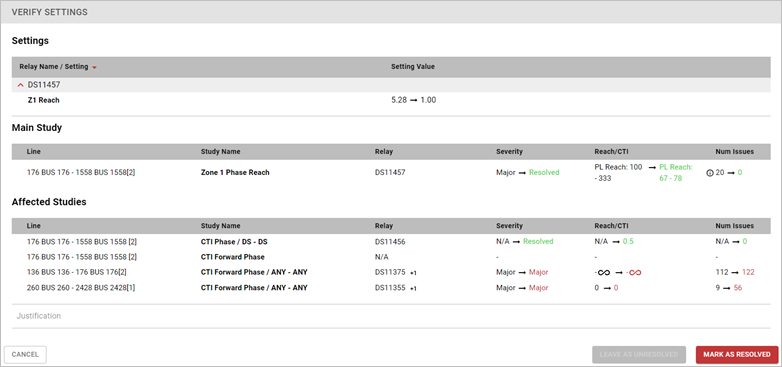
Note that the user may wish to keep the original setting but mark the violation as acceptable. In this case, the user must enter text into the “Justification” field, and then select “Mark as Resolved.”
When the user marks a violation as resolved, on the dashboard, the study is moved from the violations table to the “ACCEPTABLE” table at the bottom. The user may toggle between:
a. ALL
b. ORIGINAL – studies that were acceptable at the initial run
c. FIXED – studies that have been marked as resolved

Tip: There are multiple different buses to keep track of when solving constraints with contingencies. To help keep track of them, the following screenshot has been annotated to explain the various buses. 
- Local Bus
- Remote Bus of the relay
- Line which the relay is reaching on to evaluate for faults (can be forward and backwards depending on the Study)
- Line(s) which is being removed in the contingency
CTI Violations
For CTI Violations, SARA displays a chart similar to the single line coordination study. If reviewing a three-terminal line, the results will be shown on separate tabs (as seen in the example below). Each colored circle represents a fault placed along the line, at intervals that are specified in the template. The user may see more information about each fault by hovering over the colored circle or selecting the circle and referencing the filtered table at the bottom. Red circles indicate an operation occurring with a CTI lower than the user-set minimum CTI while blue circles indicate satisfactory CTIs.
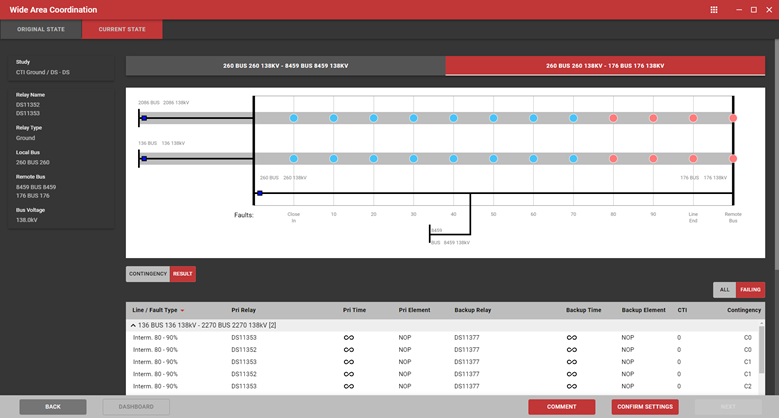
When a bus is selected, SARA displays the relays at that bus. For relays applicable to the study, a funnel icon is displayed to filter the table.
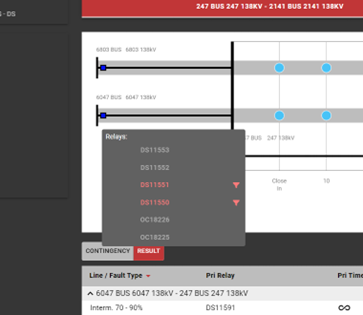
When a relay is selected, the user has the option to edit a setting and recalculate the coordination study. Changes will be shown on the left panel, under “Settings Summary.”

Similar to the constraint studies, a summary of changes is displayed when the user selects “Confirm Settings,” including other studies that are affected by the change. The user must enter justification text if marking the study as resolved when coordination violations are still present.
If the user selects a bus and relay with an Overcurrent element, a chart icon is displayed.
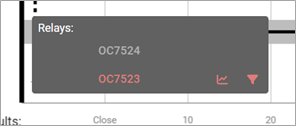
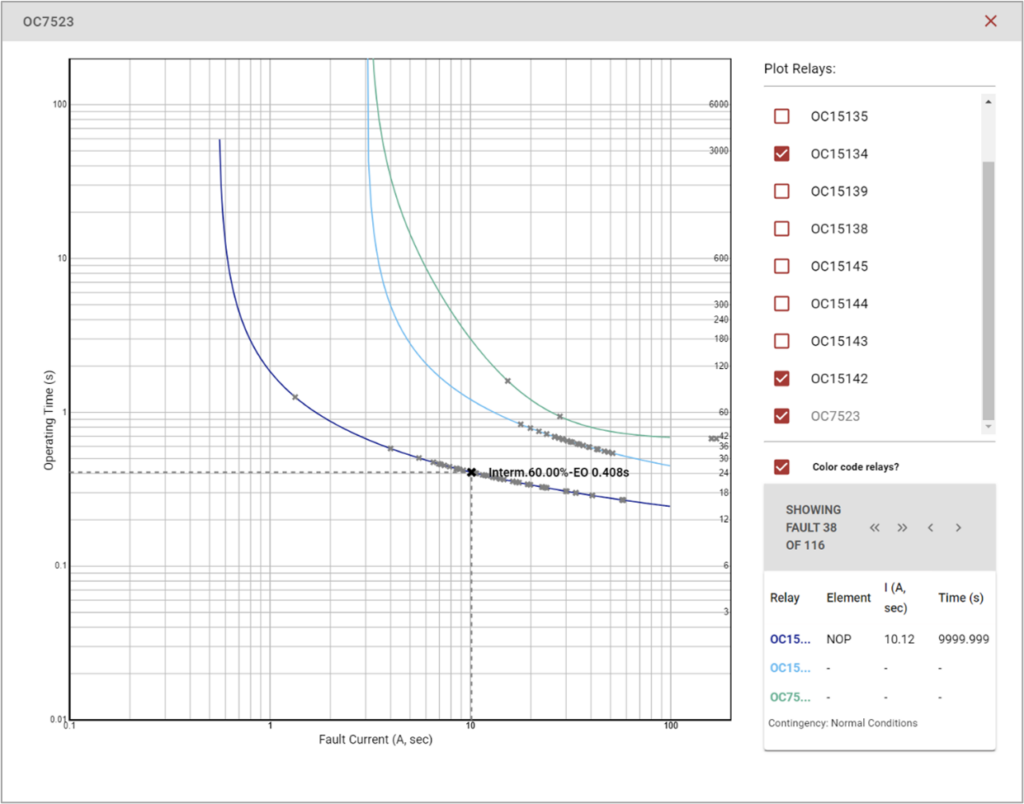
Selecting the chart icon will bring up the overcurrent curve for analysis. The user can chart additional overcurrent relays and use the left and right arrows to cycle through contingency sets and faults.
Equations
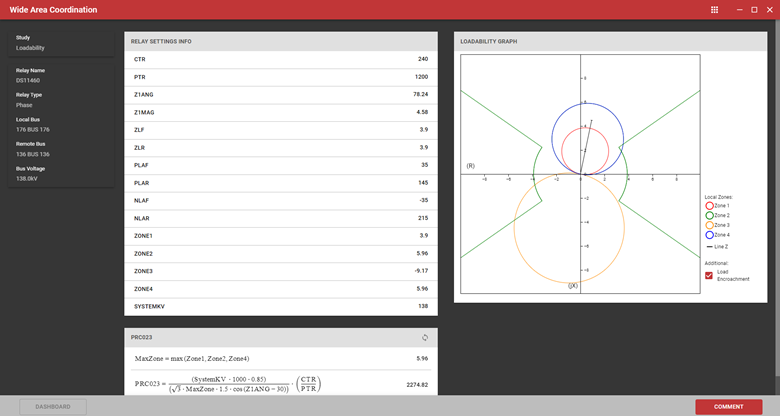
Equations studies are shown for informational purposes only. The user may review relay settings information, equation values, the Mho graph, and leave any comments to be included in the final report.
